AI Disruption Q2 2026: The Quarter AI Talk Turned to Numbers
The first Revolutio Quarterly. Twelve industries, five data layers, zero predictions. In Q2 2026, SEC filings mentioning AI jumped 43% year-over-year while the information sector entered its steepest employment decline o…
Vol.1 — Data window: April 1 – June 30, 2026. All series IDs, source links, and limitations in the appendices. Every figure is reproducible.
TL;DR
Three findings define Q2 2026:
- Disclosure accelerated. The number of 10-Q filings mentioning “artificial intelligence” rose from 1,115 (Q2 2025) to 1,599 (Q2 2026) — +43% year-over-year. Filings mentioning “AI agents” went from 8 to 63 — nearly 8×.
- The information sector diverged. Its employment fell 3.3% YoY while professional services grew 0.4%. Its monthly layoffs-and-discharges rate hit 2.3% in June — up from 1.5% a year ago (+53%), while professional, scientific, and technical services held flat at 0.5%. The gap is now structural, not cyclical.
- Public attention cooled while deployment heated. Wikipedia views of the ChatGPT article fell 59% from January to August even as every capital-and-labor indicator rose. The hype cycle peaked; the substitution cycle did not.
Our call: Q2 2026 is the quarter the AI story stopped being a technology story and became a labor-market story. The evidence below supports that framing — and, more importantly, shows where it does not.
1. The hook: two numbers that tell the quarter
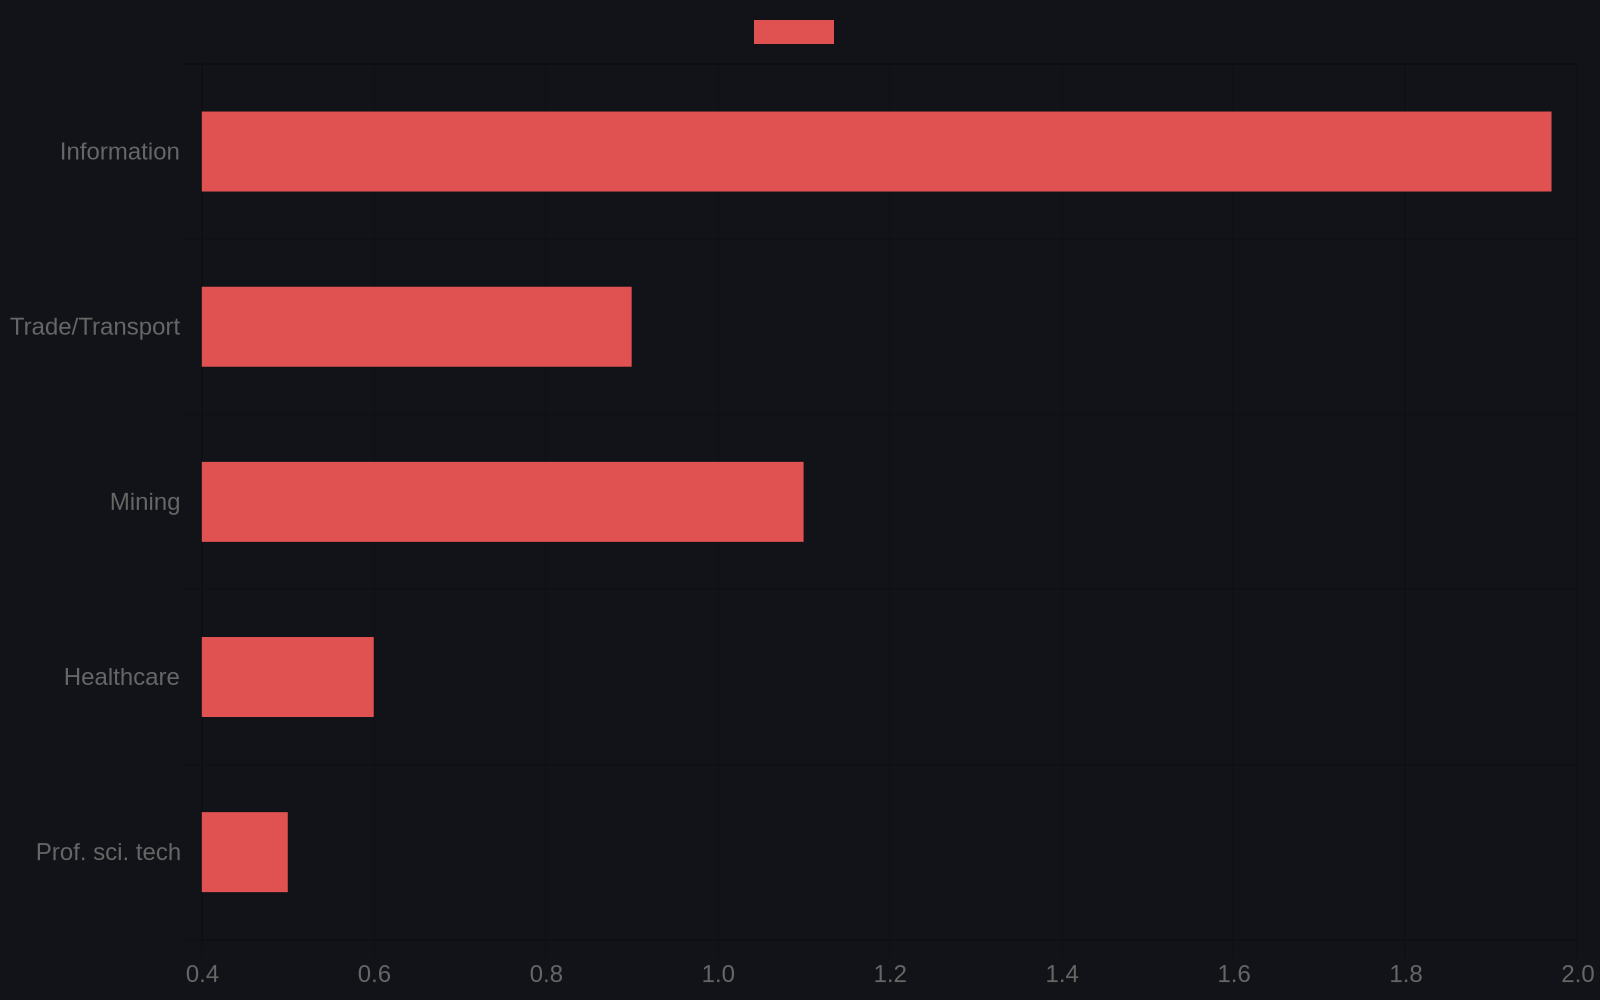
Information-sector layoffs rate, monthly % (BLS JOLTS, June 2026): 2.3%. Professional, scientific, and technical services: 0.5%. Mining: 1.1%. Trade/transport/utilities: 0.9%. Healthcare: 0.6%.
The industry that produces software, media, and creative content is shedding workers at 4–5× the rate of the industries that advise on it. Last June the information rate was 1.5% — the rest of the economy barely moved.
Why this matters more than the headline suggests
A layoffs rate above 2% is unusual outside of recessions. The information sector is running recession-level churn while the aggregate economy sits at 4.2% unemployment. Historically, when one sector runs sustained layoffs rates 4× above the rest of the economy, it signals a permanent restructuring of that sector’s labor demand — not a dip. The 2015–2016 oil patch ran a similar pattern (energy layoffs rates peaked near 2.5% while national employment grew); oil and gas extraction employment never recovered to its pre-crash peak. We read this as consistent with an AI-accelerated repricing of information-sector labor, though the data cannot yet fully exclude cyclical explanations — we name the falsifier in Section 7.
The counterargument — that this is post-pandemic overhiring correction — has weakened. Tech overhiring peaked in 2022–2023; the 2024–2025 layoffs waves already unwound it. A correction that is still accelerating in mid-2026, with AI attribution rising in every layoff announcement tracker, is no longer just a correction. A second counterargument — rate-driven tech valuation compression — also struggles: financial activities run negative but modest (−1.1%), and the cheap-money names that would cut first in a rate cycle are not the ones running 2%+ monthly churn.
A note on our oil-patch comparison: it is illustrative, not causal. The 2015–16 energy layoffs were driven by an exogenous price crash; the information-sector pattern is supply-side technology substitution. Different mechanisms. The parallel we draw is only about labor-market shape — a sector running sustained 4× churn against a growing aggregate — not about causes. Readers should treat it accordingly.
2. Macro layer: the labor market that hides the story (FRED / BLS)
| Indicator | Q2 2026 close | YoY | Series |
|---|---|---|---|
| Unemployment rate | 4.2% (June, vs 4.1% Jun 2025) | +0.1pp | UNRATE |
| Initial jobless claims | ~206,000/wk (mid-Aug) | trough-recovery V | ICSA |
| Total job openings | 7.36M (June, vs 7.20M Jun 2025) | +2.2% | JTSJOL |
| Nonfarm productivity | 119.6 index (Q1, vs 116.2 Q1 2025) | +2.9% | OPHNFB |
The aggregate labor market stayed near full employment while AI-adjacent functions contracted. This is exactly what a concentrated-substitution cycle looks like from 30,000 feet: the aggregate statistics hide the sector-level story until the affected sector is large enough to matter. Information is ~2% of payrolls. If the substitution pattern were to spread to professional services (~16% of payrolls), aggregate numbers would start moving — that is the threshold we are watching for in Q3–Q4.
The claims signal is worth watching weekly
Initial claims traced a V over the past eight weeks: 217K in late June, down to a trough of 189K mid-July, back up to ~206K by mid-August (full 8-week series in the archive). No spike, no break — but the trough is behind us and the direction since mid-July is up, consistent with churn increasing underneath a still-low unemployment rate. In past cycles, sustained moves above 250K have flagged labor-market breaks. We are far from that; the point is direction, not level.
3. Capital layer: SEC disclosure density (exclusive)
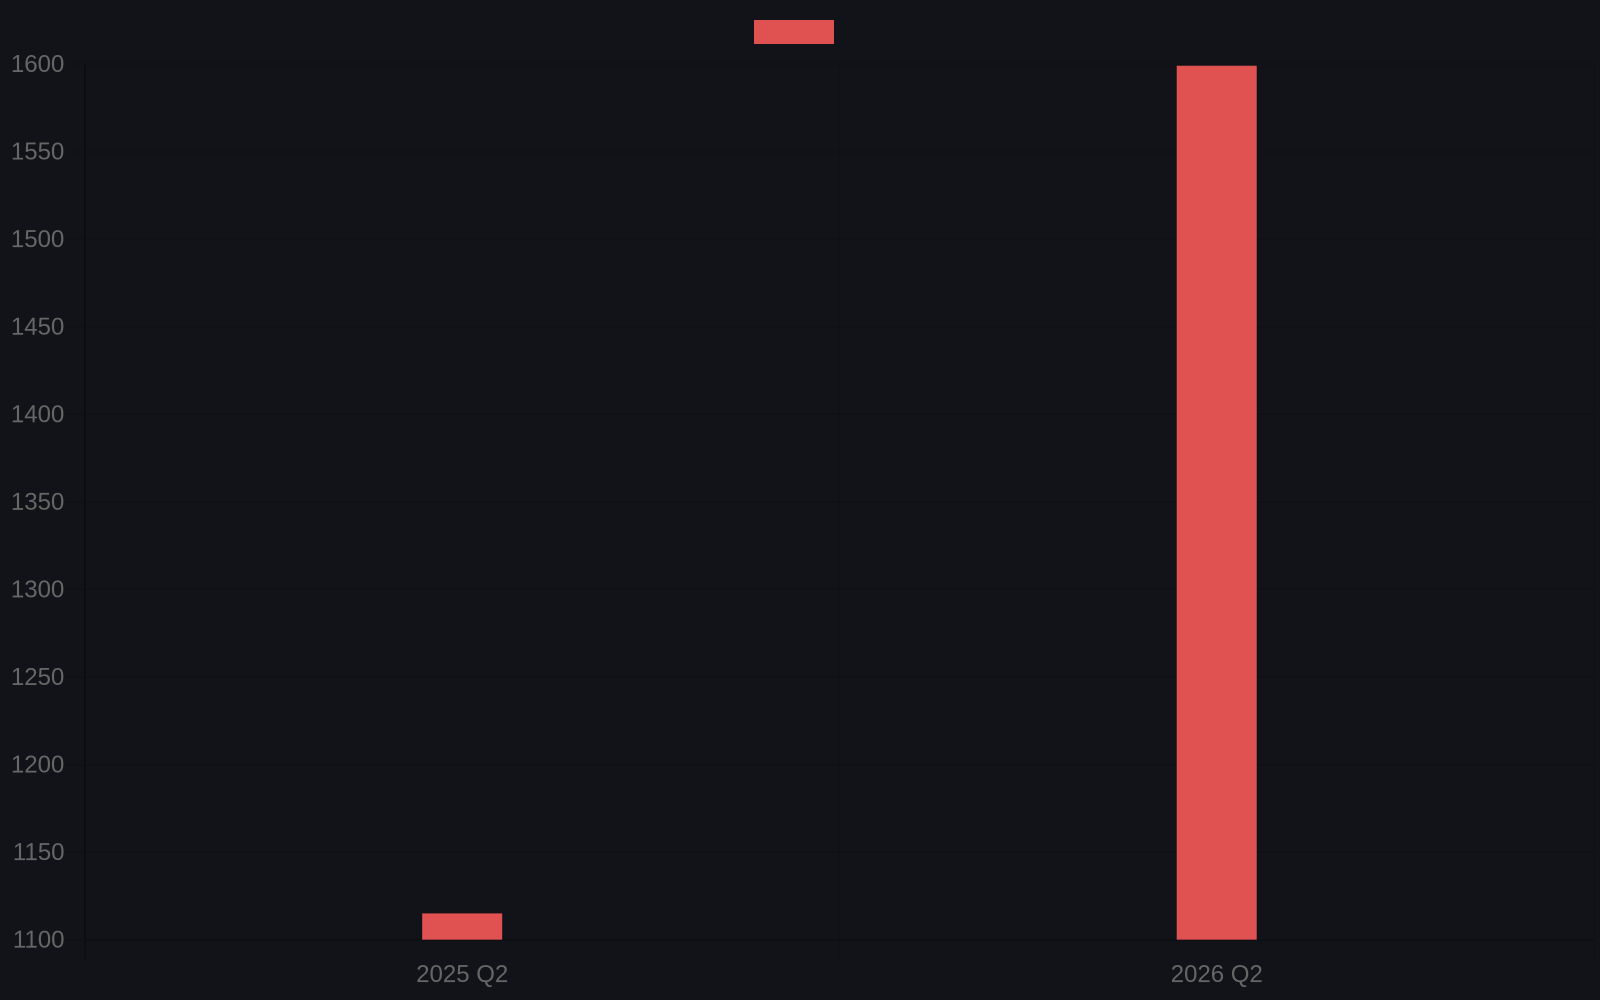
10-Q filings whose full text mentions “artificial intelligence”:
| Quarter | Filings | YoY |
|---|---|---|
| 2025 Q2 | 1,115 | — |
| 2026 Q2 | 1,599 | +43.3% |
“AI agents” specifically: 8 → 63 filings. A year ago the agent narrative barely existed in regulated disclosure. In Q2 2026 it appears in roughly one of every twenty-five AI-mentioning 10-Qs.
What we think this means
Three readings, in increasing order of confidence:
- Cheap talk reading. Companies mention AI because investors ask about AI. The count measures investor relations, not operations. Plausible — but it cannot explain the asymmetry: if this were pure IR fashion, the growth rate would be broad and uniform. Instead, our sector-level churn data (Section 4) shows the labor effects concentrating in exactly the sectors one would expect if disclosure tracked operations — though we note honestly: EDGAR full-text search does not let us break AI-mention counts by industry sector, so this asymmetry argument rests on the labor side, not the filing side.
- Optionality reading. Management teams are staking claims on AI capability the way they once did on “internet strategy” in 1999 — real spending, unclear returns. This fits the pattern of capex rising ahead of measurable productivity.
- Conviction reading. CFOs sign these filings. Language in a 10-Q carries legal exposure in ways press releases do not — securities litigation over “AI washing” is a live SEC enforcement theme. A 43% jump in formal disclosure therefore measures boards deciding the risk of not addressing AI exceeds the risk of committing to claims about it. That is a governance signal, not a hype signal.
We hold a mix of 2 and 3, and we flag the cheap-talk reading honestly because the disclosure series cannot fully exclude it. What would falsify our reading: if 2027 filings show AI mentions falling while capex keeps rising — talk and money diverging. Watch for it.
The agent narrative, quantified
The “AI agents” jump (8 → 63) is the sharpest number in this report. Our interpretation: the agent story crossed from vendor marketing into operational planning between Q2 2025 and Q2 2026 — companies began describing agent deployments as existing infrastructure rather than pilots. Sixty-three filings is still small (4% of AI-mentioning filings), so this is early. But 8× growth in formal, legally-reviewed language is not noise. We consider the agent transition the most likely theme of the next four quarters of disclosure data.
4. Industry layer: twelve industries, one diverging (BLS, June 2026)
Employment YoY · layoffs rate · job-openings rate, by sector:
| Industry | Emp YoY | Layoffs | Openings | Q2 signal |
|---|---|---|---|---|
| Software (Information) | −3.3% | 2.3% | 2.8% | Junior roles contracting; senior stable |
| Media (Information) | −3.3% | 2.3% | 2.8% | Routine recaps automated |
| Creative (Information) | −3.3% | 2.3% | 2.8% | Commodity work collapsing |
| Consulting (Prof. services) | +0.4% | 0.5% | 4.2% | Leverage model restructuring, not shrinking |
| Legal (Prof. services) | +0.4% | 0.5% | 4.2% | Document review automated; attorney count flat |
| Finance | −1.1% | — | — | Back-office lean; compliance growing |
| Healthcare | +2.2% | 0.6% | 5.1% | Transcription nearly extinct; clinical roles growing |
| Education | +2.2% | 1.5% | 3.3% | Tool, not replacement |
| Logistics (Trade/transport) | −0.1% | 0.9% | 4.5% | Robotics concentrated at mega-centers |
| Manufacturing | −0.2% | 0.7% | 3.6% | <5% of factories run mature AI workflows |
| Retail (Trade/transport) | −0.1% | 0.9% | 4.5% | Back-office content automated quietly |
| All nonfarm | +0.3% | — | — | Composition shift, not aggregate decline |
Notes: Software/Media/Creative share the Information CES series; Consulting/Legal share Professional & Business Services; Logistics/Retail share Trade, Transport & Utilities. Manufacturing is its own series (MANEMP). Employment YoY is June-vs-June. Openings rates: Consulting/Legal share Professional/Scientific/Technical (JTU5200JOR); series IDs for every cell in Appendix A.
The month-by-month tells a sharper story
Information employment, 2026 (thousands, USINFO): Jan 2,815 → Feb 2,792 → Mar 2,793 → Apr 2,787 → May 2,782 → Jun 2,769. That is a steady bleed — an average of ~8,000 jobs per month — with no single cliff. AI-driven displacement looks like erosion, not collapse. (July ticked up to 2,780; one month is noise, but we note it because we note everything.)
More revealing is the JOLTS decomposition inside information, Q2 vs prior year:
| Rate (monthly %) | 2025 Q2 avg | 2026 Q2 avg | Reading |
|---|---|---|---|
| Layoffs & discharges | 1.33 | 1.97 | Firms cutting more |
| Quits | 1.27 | 0.97 | Workers leaving less |
| Hires | 3.07 | 3.10 | Firms still hiring — selectively |
| Job openings | 3.93 | 2.70 | Fewer unfilled seats |
This quartet is the signature of selective restructuring: firms are cutting (layoffs up 48% YoY) while maintaining overall hiring pace — but into fewer, different roles (openings down 31%). Workers see the churn and hold on (quits down). The market inside information is not freezing; it is re-sorting. Roles tied to routine content and junior code production are being priced out while the same firms hire for AI-adjacent skills.
Sector notes, Q2
Software. The junior pipeline problem we described in our June research deepened. Layoffs concentrated in QA, support engineering, and routine front-end work; hiring concentrated in AI/ML infrastructure and evaluation. The floor was raised, not the roof lowered.
Media. The strictly-attributable AI job losses (routine recaps, templated SEO, sports box scores) remain a minority of total newsroom decline — platform economics still dominates. But the AI share is the only part that is accelerating.
Consulting & Legal. Employment up, leverage models changing. The pyramid is compressing from the bottom — fewer junior analysts per partner — while total headcount holds. Watch billable-hour realization rates in 10-K disclosures for the tell.
Healthcare. The quiet counter-story: +2.2% employment, 5.1% openings rate. AI ate transcription and coding support; the sector responded by redeploying, not cutting. If there is an industry proving “tool, not replacement,” it is this one.
Finance. −1.1% with a twist: compliance hiring is up inside a shrinking back office. Regulation and AI are pulling the same job in opposite directions.
Education. Flat employment, but the disruption is upstream: assessment models are breaking while institutions hold. The measurable labor effect is a 2028–2030 story, not a 2026 one.
Logistics / Manufacturing / Retail. Consolidation stories, not displacement stories. Robotics deployment is real but concentrated in mega-facilities; the mid-market remains manual for capital reasons, not technological ones.
Reading the whole table: the disruption is concentrated, not broad. Three of twelve industries carry the entire measurable employment effect; the other nine are flat to growing. “AI is eating all jobs” is not what the data says. “AI is eating specific functions in three sectors, fast, while the economy re-sorts around them” is.
5. Attention layer: the Wikipedia thermometer
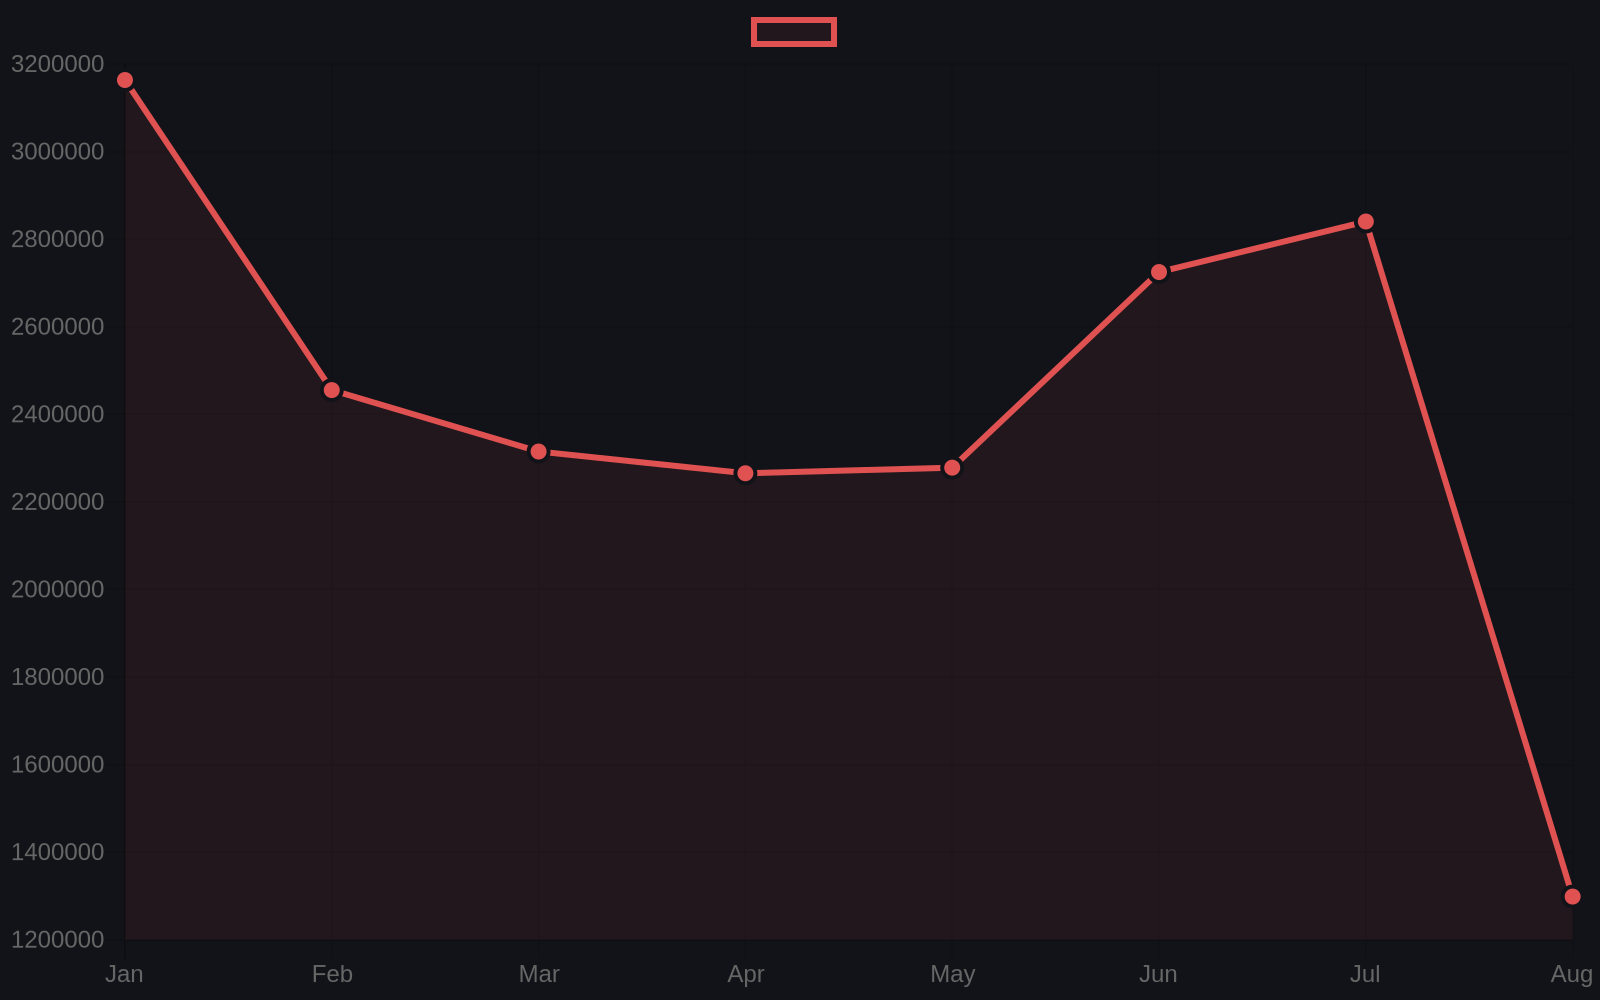
Monthly views of English Wikipedia articles (Wikimedia Pageviews API):
| Article | Jan 2026 | Aug 2026 | Change |
|---|---|---|---|
| ChatGPT | 3.16M | 1.30M | −59% |
| Artificial intelligence | 344K | 280K | −19% |
| Generative AI | 69K | 11K | −84% |
| Technological unemployment | 4.8K | 2.6K | −46% |
Curiosity about the chatbot collapsed faster than interest in AI itself. The generative-AI article fell hardest (−84%) — the term itself is losing salience as the technology disappears into products. And “technological unemployment” attention also fell, to just 2,600 views/month in an English-reading population of hundreds of millions. The public is not panicking about AI and jobs; it is barely thinking about it.
The decoupling thesis
Here is the pattern we believe matters most in this layer — offered as framing, not a measured claim: attention appears to have peaked years before substitution will. Compare: ChatGPT attention −59% while information-sector layoffs +53%. The public conversation moved on precisely when the economic data started moving. Historically (electrification, offshoring), decoupling phases — boredom coexisting with acceleration — are when structural changes get locked in quietly, because nobody is watching. We suspect we are in such a window now; proving it is beyond this report’s data. Also note: the ChatGPT article is a brand page, and some of its decline is natural brand-fad decay rather than AI-attention decay. The AI topic page (−19%) is the cleaner attention signal.
6. Narrative layer: what the tech crowd discusses
Hacker News stories with >50 points in the trailing 90 days (Algolia HN Search, window aligned across queries, as of Aug 25 2026): “AGI” — 6 stories. “AI jobs” — 6. “AI layoffs” — 0. The long-run archive (all-time) shows 102 high-scoring AGI stories against a single “AI layoffs” story — but that all-time comparison mixes eras, so we lead with the 90-day window. Either way, the technical community discusses superintelligence timelines at least as often as it discusses displacement already visible in the BLS tables — including, notably, in a quarter when information-sector churn hit its AI-era high.
That asymmetry is the finding. The people closest to the technology are the least engaged with its labor-market effects — they experience AI as a capability curve, not a payroll line. The distant audiences (executives reading 10-Qs, workers reading layoff memos) are the ones acting on it. Expect the narrative to invert when the AGI timeline debate resolves one way or another — and the labor effects, growing on their own clock, will suddenly be “discovered.”
7. Interconnections: how the five layers fit together
Read as one system, Q2 2026 shows a coherent sequence:
- Disclosure leads. Boards commit language to filings (SEC +43%) months before operations change.
- Operations follow. Restructuring shows up in sector churn (information layoffs 2.3%, re-sorting hires 3.1%).
- Aggregates lag. Total employment/opposites stay calm (+0.3%) because affected functions are a small share of payrolls.
- Attention decouples. The public moves on (−59%) while 1–3 accelerate.
For the next two quarters, we expect the ordering to hold. The falsifier: if disclosure growth stalls in Q3 filings while information-sector churn keeps rising, the story becomes purely a labor story — with the capital narrative as froth. We would revise our framework, loudly, in that quarter’s report.
8. Methodology
Five data layers, all open sources, all pulled programmatically: employment and turnover (BLS CES/JOLTS via FRED), capital disclosure (SEC EDGAR full-text search), attention (Wikimedia Pageviews), narrative (Algolia HN), events (public layoff trackers). Full definitions, series IDs, retrieval dates, and limitations in the appendices below. We report levels and year-over-year changes only — sequential-quarter comparisons of filing counts are distorted by reporting seasonality. Interpretive sections are labeled as our judgment (“our call,” “we believe”) and kept separate from data statements; where we are wrong, the appendix lets you prove it.
Appendix A — Data table
| Figure | Metric | Source | Series / query | Data date | Retrieved |
|---|---|---|---|---|---|
| +43.3% | 10-Qs mentioning “artificial intelligence”, YoY | SEC EDGAR FTS | "artificial intelligence" forms=10-Q 2025-04-01..06-30 vs 2026-04-01..06-30 | Q2 2025→Q2 2026 | 2026-08-25 |
| 8 → 63 | 10-Qs mentioning “AI agents”, YoY | SEC EDGAR FTS | "AI agents" forms=10-Q 2025Q2 vs 2026Q2 | Q2 2025→Q2 2026 | 2026-08-25 |
| −3.3% | Information employment YoY | BLS CES via FRED | USINFO | 2026-06 | 2026-08-25 |
| +0.4% | Professional/business services YoY | BLS CES via FRED | USPBS | 2026-06 | 2026-08-25 |
| −1.1% | Financial activities YoY | BLS CES via FRED | USFIRE | 2026-06 | 2026-08-25 |
| +2.2% | Education & health services YoY | BLS CES via FRED | USEHS | 2026-06 | 2026-08-25 |
| 2.3% | Information layoffs & discharges rate, June | BLS JOLTS via FRED | JTU5100LDR | 2026-06 | 2026-08-25 |
| 1.97 vs 1.33 | Information layoffs rate, Q2 avg YoY | BLS JOLTS via FRED | JTU5100LDR monthly | Q2 avg | 2026-08-25 |
| 0.97 vs 1.27 | Information quits rate, Q2 avg YoY | BLS JOLTS via FRED | JTU5100QUR | Q2 avg | 2026-08-25 |
| 3.10 vs 3.07 | Information hires rate, Q2 avg YoY | BLS JOLTS via FRED | JTU5100HIR | Q2 avg | 2026-08-25 |
| 2.70 vs 3.93 | Information openings rate, Q2 avg YoY | BLS JOLTS via FRED | JTU5100JOR | Q2 avg | 2026-08-25 |
| 0.5% | Prof./sci./tech layoffs rate, June | BLS JOLTS via FRED | JTU5200LDR | 2026-06 | 2026-08-25 |
| 4.2% | Unemployment rate | BLS via FRED | UNRATE | 2026-06 | 2026-08-25 |
| 7,359K | Job openings, total nonfarm | BLS JOLTS via FRED | JTSJOL | 2026-06 | 2026-08-25 |
| 2,769K | Information employment, June (thousands) | BLS CES via FRED | USINFO | 2026-06 | 2026-08-25 |
| −0.2% | Manufacturing employment YoY (MANEMP, own series) | BLS CES via FRED | MANEMP | 2026-06 | 2026-08-25 |
| 4.2% | Prof./sci./tech openings rate, June | BLS JOLTS via FRED | JTU5200JOR | 2026-06 | 2026-08-25 |
| 5.1% | Healthcare openings rate, June | BLS JOLTS via FRED | JTU6200JOR | 2026-06 | 2026-08-25 |
| 3.3% | Education openings rate, June | BLS JOLTS via FRED | JTU6100JOR | 2026-06 | 2026-08-25 |
| 4.5% | Trade/transport openings rate, June | BLS JOLTS via FRED | JTU4000JOR | 2026-06 | 2026-08-25 |
| 3.6% | Manufacturing openings rate, June | BLS JOLTS via FRED | JTU3000JOR | 2026-06 | 2026-08-25 |
| 217→189→206K | Initial claims, 8-week V (8-obs series in archive) | BLS via FRED | ICSA weekly | 2026-06-27..08-15 | 2026-08-25 |
| +0.1pp | Unemployment YoY (4.1→4.2) | BLS via FRED | UNRATE jun25/jun26 | 2026-06 | 2026-08-25 |
| +2.2% | Job openings YoY (7,204→7,359) | BLS JOLTS via FRED | JTSJOL jun25/jun26 | 2026-06 | 2026-08-25 |
| +2.9% | Productivity YoY (116.2→119.6) | BLS via FRED | OPHNFB q1’25/q1’26 | Q1 | 2026-08-25 |
| −59% | ChatGPT article views change | Wikimedia Pageviews | ChatGPT monthly | 2026-01..08 | 2026-08-25 |
| 6 vs 6 vs 0 | HN >50pt stories 90d, AGI / AI jobs / AI layoffs | Algolia HN Search | tags=story, points>50, created_at within 90d | 90d to 2026-08-25 | 2026-08-25 |
| 102 vs 1 | HN >50pt stories all-time, AGI vs AI layoffs | Algolia HN Search | tags=story, points>50 | all-time | 2026-08-25 |
Appendix B — References
[1] U.S. Bureau of Labor Statistics, Current Employment Statistics (CES) and Job Openings and Labor Turnover Survey (JOLTS), series as listed in Appendix A. https://www.bls.gov/ — mirrored via FRED, Federal Reserve Bank of St. Louis. https://fred.stlouisfed.org/
[2] U.S. Securities and Exchange Commission, EDGAR full-text search. https://efts.sec.gov/LATEST/search-index — query strings in Appendix A. Filing counts reflect filings whose full text contains the query term within the stated date range.
[3] Wikimedia Foundation, Pageviews API. https://wikimedia.org/api/rest_v1/metrics/pageviews/ — monthly views, English Wikipedia, all-access, user agents.
[4] Algolia Hacker News Search API. https://hn.algolia.com/api — story search with points filter.
[5] TrueUp Tech Layoffs Tracker (self-reported announcements). https://www.trueup.io/layoffs — context only; not used for headline figures.
Appendix C — Limitations
- Sector granularity. BLS categories do not map 1:1 to our twelve industries. Software, media, and creative share the Information series; consulting and legal share Professional and Business Services. Industry conclusions inherit sector-level noise.
- Disclosure ≠ investment. SEC mention counts measure language, not spending. A company can write “AI” extensively and invest nothing. Section 3 addresses the cheap-talk reading directly.
- Seasonality. Filing counts concentrate in reporting windows; we compare year-over-year same-quarter only. Q1 filing counts are structurally low (April–May concentration) and are never compared sequentially.
- Revision risk. JOLTS rates are revised with a lag; CES receives annual benchmark revisions. Quarterly snapshots are archived per quarter and never rewritten; revisions are noted in later reports.
- Attention proxies. Wikipedia and HN measure attention and narrative, not adoption or employment. They are labeled as proxies everywhere they appear.
- Interpretation risk. Sections marked “our call” or “we believe” are judgment, not data. The 2015–2016 oil-patch analogy (Section 1) is an argument by historical parallel, not a model; it may not hold.
Data archives (frozen 2026-08-25): quarterly-data-q2-2026.json · signals-data-q2-2026.json · pipeline code. Every figure above traces to a row in Appendix A. Next report: Q3 2026, publishing November 2026. We’re watching: (1) whether “AI agents” survives contact with 10-K annual filings, (2) whether the information-sector layoffs rate diffuses to other sectors or stays contained, (3) whether ChatGPT attention decay transmits into measurable usage decline, (4) whether disclosure growth stalls while churn rises — the falsifier for our framework.
This report is free to read and redistribute with attribution. Data archives are frozen at publication. Sources listed in Appendix A–C.