Industries we track
Twelve sectors under active monitoring. Each rated by disruption stage, backed by verifiable data. BLS series as of 2026-09 · signals update 2-3× weekly.
Actively Disrupting
Restructuring
Early Stage
 legal
Legal
Actively Disrupting creative
Creative
Actively Disrupting finance
Finance
Restructuring healthcare
Healthcare
Early Stage labor
Labor Market
Uneven software
Software Development
Restructuring education
Education
Early Stage retail
Retail & E-commerce
Early Stage logistics
Logistics
Actively Disrupting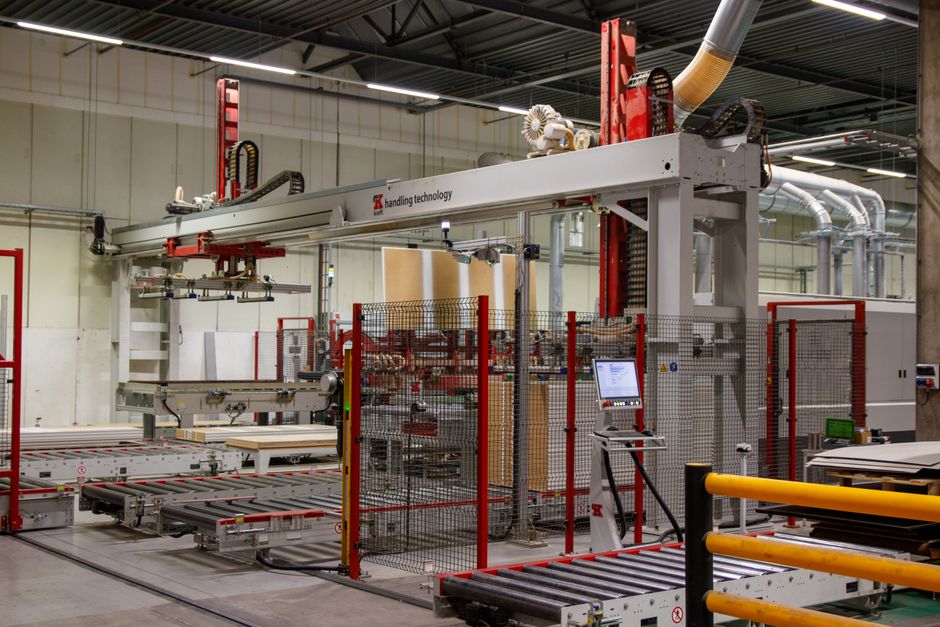 manufacturing
Manufacturing
Narrow media
Media & Journalism
Actively Disrupting consulting
Consulting
RestructuringSector briefs
One line per sector: the headline number, what it measures, and where the analysis lives.
Legal -14% First-year associate class size, 2023→2025American Lawyer staffing survey Document review and e-discovery automated. Junior associate hiring down 14%. Attorney employment flat. Read → Creative -47% Freelance writing job postingsUpwork/Fiverr marketplace analysis Stock photography in terminal decline. Commodity design and writing collapsing. Specialized creative thriving. Read → Finance -2% Net finance headcount changeBLS financial occupations Back-office operations shrinking 15-25%. Compliance paradoxically growing. Relationship banking untouched. Read → Healthcare -55% Transcriptionist employment since 2020BLS OEWS, SOC 31-9094 Medical transcription nearly extinct. Coding restructuring. Clinical roles completely unaffected. Read → Labor Market -3.9% Customer service employment YoY (NAICS 5614)BLS CES6056140001 Customer support, entry-level writing, and translation actively displaced. Skilled trades and healthcare unaffected. Read → Software Development -1.1% Computer systems design employment YoYBLS CES6054150001 Junior tier contracting while senior engineering grows — the bottom of the ladder is thinning. Net employment roughly flat. Read → Education +0% Teacher employment changeBLS educational services Teacher employment stable. Student AI usage skyrocketing. Disruption is in how students learn, not how schools operate. Read → Retail & E-commerce +0.3% Retail employment YoY (back-office quietly automated)BLS retail trade Product descriptions, SEO copy, and inventory forecasting automated. Physical retail and in-store experience unaffected. Read → Logistics 4.7M Warehouse robots installed by 2026ABI Research / Sellers Commerce Warehouse robotics concentrated at mega-fulfillment centers. Autonomous trucking commercial on Texas corridors. Mid-market still manual. Read → Manufacturing <5% US factories with mature AI workflowsDeloitte Smart Factory Survey 2025 Machine vision inspection and demand forecasting crossed into routine deployment. The lights-out factory remains aspirational. Read → Media & Journalism -17% Newsroom employment since 2023 (AI ≈25-35% of it)Pew Research newsroom data Routine earnings recaps, sports, and templated SEO content automated. Broader newsroom collapse predates AI by 15 years. Read → Consulting 30-60% Research hours compressed by AIMcKinsey Global Institute Entry-level analyst hiring contracting as AI compresses research hours 30-60%. Billable-hour leverage model bending, not breaking. Read →
Data notes
Each card uses the closest BLS series available via FRED — employment at NAICS industry level where it exists, JOLTS rates at the most detailed level published. Latest employment YoY, JOLTS layoffs and openings rates (as of the BLS release noted above) live in this table so the cards stay scannable. Series IDs make every number reproducible. Where two industries share a JOLTS series (BLS publishes JOLTS only at sector level), that is noted explicitly.
| Industry | Emp. YoY | Layoffs | Openings | Employment series | JOLTS basis |
|---|---|---|---|---|---|
| Legal | +1.45% | 1.6% | 4.8% | Legal Services CES6054110001 | JOLTS professional and business services |
| Creative | -0.76% | 4.2% | 3.5% | Arts, Entertainment & Recreation CES7071000001 | JOLTS arts, entertainment & recreation |
| Finance | -1.13% | 0.8% | 4.8% | Financial Activities USFIRE | JOLTS financial activities |
| Healthcare | +1.41% | 0.9% | 5% | Health Care (excl. social assistance) CES6562000101 | JOLTS health care |
| Labor Market | +0.39% | — | — | Total Nonfarm PAYEMS | — |
| Software Development | -1.06% | 0.9% | 4.4% | Computer Systems Design & Related Services CES6054150001 | JOLTS information sector |
| Education | +0.18% | 1.6% | 3.2% | Educational Services CES6561000001 | JOLTS educational services |
| Retail & E-commerce | +0.43% | 1.2% | 3% | Retail Trade USTRADE | JOLTS retail trade |
| Logistics | +0.81% | 1.1% | 4.7% | Transportation & Warehousing CES4300000001 | JOLTS transportation, warehousing & utilities |
| Manufacturing | +0.57% | 0.8% | 4% | Manufacturing MANEMP | JOLTS manufacturing |
| Media & Journalism | -2.61% | 0.9% | 4.4% | Publishing Industries (excl. internet) CES5051100001 | JOLTS information sector |
| Consulting | +0.88% | 1.6% | 4.8% | Management, Scientific & Technical Consulting CES6054160001 | JOLTS professional and business services |